When your Mac starts lagging or the fans kick on high, the first thing you need to check is your processor. The CPU is the engine of your computer. If a single app is using 100% of the CPU, every other app has to wait in line, causing your entire system to stutter and freeze.
Here is the fastest way to check your CPU usage using built-in macOS tools and how to actually understand the numbers you are looking at.
Step 1: Open Activity Monitor
Apple includes a free utility on every Mac called Activity Monitor. It is the equivalent of the Task Manager on Windows.
The fastest way to open it is using Spotlight Search:
- Press Cmd + Space on your keyboard to open Spotlight.
- Type "Activity Monitor" and press Enter.
Alternatively, you can open a Finder window, go to the Applications folder, open the Utilities folder, and double-click Activity Monitor.
Step 2: Read the CPU Tab
When Activity Monitor opens, click the CPU tab at the top of the window. You will see a massive, constantly moving list of every single process running on your Mac.
To make sense of it, click the column header labeled % CPU. This will sort the list so the most demanding apps are pinned to the top.
- Under 10%: Completely normal background activity.
- 10% to 50%: Normal for an app you are actively using, like a web browser rendering a heavy webpage or a video call.
- Over 90%: The app is working extremely hard. If you are exporting a video or playing a game, this is normal. If you are just looking at a blank document and an app is stuck at 99%, it has frozen and is hoarding resources.
Step 3: Understand System vs User Load
At the very bottom of the Activity Monitor window, you will see a small box with three metrics: System, User, and Idle.
- User: The percentage of the CPU being used by apps you opened, like Chrome, Spotify, or Word.
- System: The percentage being used by core macOS background processes.
- Idle: The percentage of the CPU that is completely free and waiting for instructions.
If your Mac is lagging and the "System" percentage is extremely high, you might have a rogue background process. Look for confusing names like mds_stores or kernel_task at the top of your list. We explain these in our guides on What is kernel_task? and What is WindowServer?.
Step 4: Force Quit Stuck Apps
If you spot an app that is clearly stuck at 100% CPU and causing your Mac to freeze, you can kill it directly from this window.
- Click the name of the misbehaving app in the list to select it.
- Click the small X button at the top of the Activity Monitor window.
- Click Force Quit in the confirmation popup.
The app will immediately close, releasing the CPU and instantly speeding up your Mac.
A Better Way to Monitor Your CPU
Checking Activity Monitor is great when your Mac is already frozen. But by the time you open it, the damage is done.
If you want to keep an eye on your system health and catch rogue apps before they freeze your computer, you need MacStats.
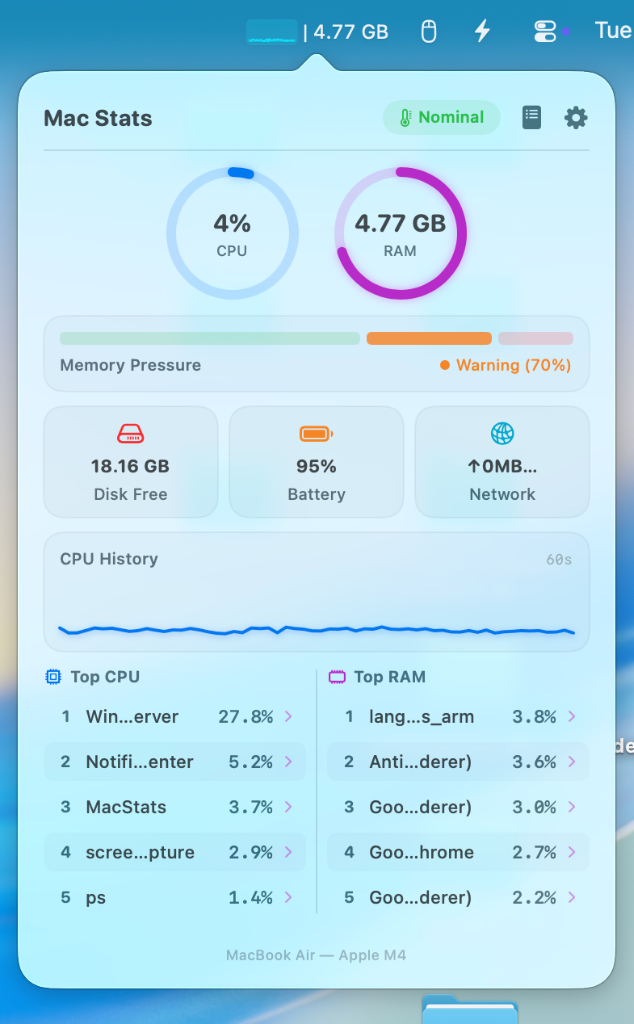
MacStats is a native menu bar app that gives you a continuous, real-time look at your CPU usage. You do not have to open a separate app. The data is always right there in your menu bar.
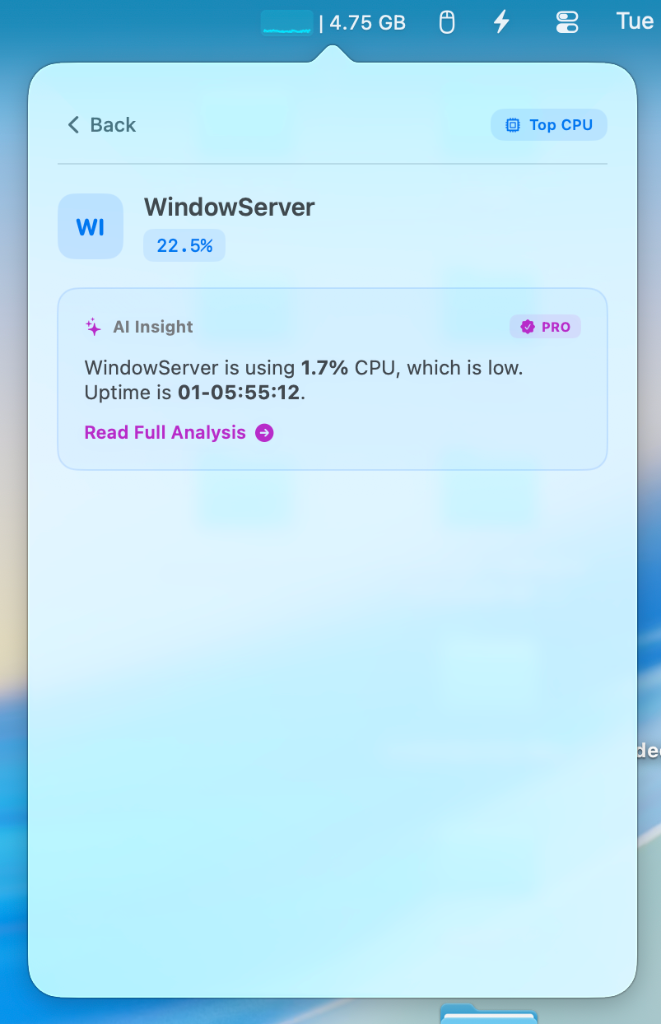
Even better, MacStats features an AI Process Explainer. If you see a weird system process spiking your CPU, you do not have to Google it. Just click the process in the MacStats menu, and it will give you a plain English explanation of exactly what that process is doing and whether it is safe to force quit.
Stop waiting for your Mac to freeze. Download MacStats for Free and get continuous visibility into your CPU. Check out how it transforms your workflow in our guide on MacStats vs Activity Monitor.
Stop guessing what your Mac is doing.
Activity Monitor shows you numbers. MacStats explains them in plain English using AI. Keep an eye on your system health straight from your menu bar.
Download MacStats Free