If you open Activity Monitor on your Mac and look at the Memory tab, the numbers are usually terrifying. Even if you only have a few web tabs open, it might say you are using 14GB out of 16GB of RAM.
Most people assume this means their Mac is running out of memory. They start force-quitting apps, trying to get that "Memory Used" number as low as possible.
This is a complete waste of time. On a Mac, high memory usage is completely normal. The only metric that actually matters is a tiny graph at the bottom of the window called Memory Pressure.
Here is exactly how Memory Pressure works and how to read it.
Why High Memory Usage is Normal
Apple designed macOS to be extremely aggressive with RAM. The philosophy is simple: unused RAM is wasted RAM.
If you have 16GB of memory installed, macOS wants to use all 16GB. It intentionally takes files you recently used and caches them into your empty RAM. Because RAM is thousands of times faster than your SSD hard drive, keeping files cached in RAM makes launching apps and switching tasks feel instantaneous.
When you open a brand new, heavy application, macOS instantly dumps the old cached files to make room for the new app.
Because of this caching system, your "Memory Used" number will almost always be near 100%. This does not mean your computer is struggling. It means it is working efficiently.
How to Read the Memory Pressure Graph
Since "Memory Used" is meaningless, Apple introduced the Memory Pressure graph to show you the true health of your system.
Memory Pressure evaluates how hard your Mac is working to juggle data in and out of RAM. It uses a simple color-coding system.
- Green (Healthy): Your Mac has plenty of room to maneuver. Even if all your RAM is technically full, the system is easily managing the workload. You have absolutely nothing to worry about.
- Yellow (Warning): Your Mac is starting to feel the strain. It is actively searching for background apps to compress to make room for your active tasks. You might notice a slight stutter when switching apps.
- Red (Critical): You are completely out of RAM. The system is heavily relying on "Swap" memory, which means it is using your slow hard drive as temporary RAM. Your Mac will become severely sluggish and unresponsive.
If your graph is red, you need to find the apps hoarding your memory and close them. Read our guide on Why is my Mac using so much RAM? for step-by-step instructions.
A Better Way to See Memory Pressure
Activity Monitor is fine for a quick check, but it is too complex to leave open all day. If you want to keep a casual eye on your Memory Pressure without disrupting your workflow, you need MacStats.
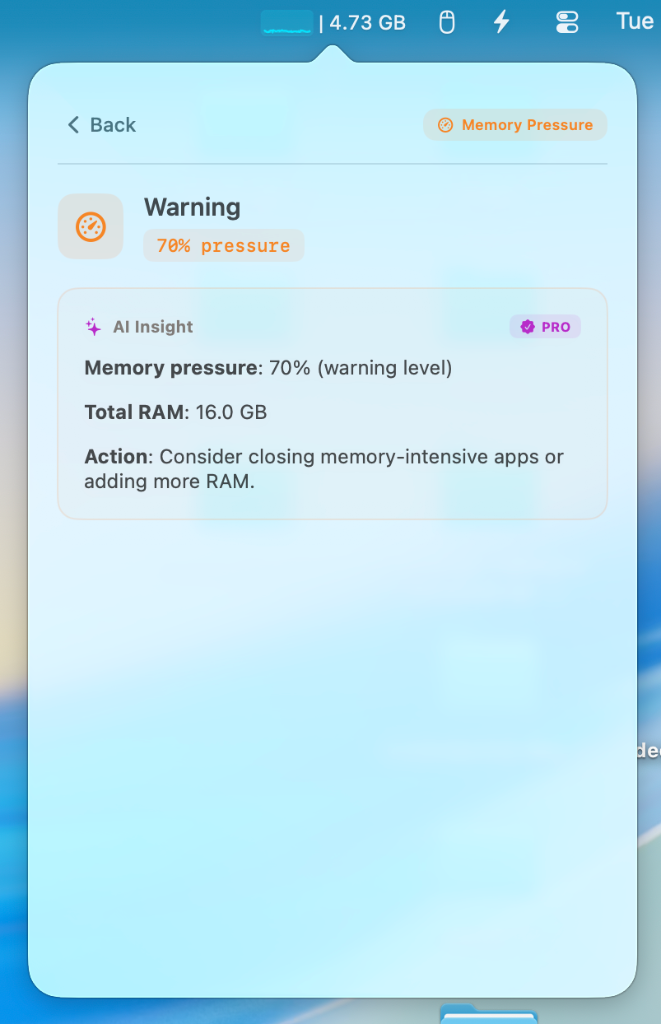
MacStats is a native menu bar app that displays a live Memory Pressure gauge right at the top of your screen. You can instantly see if your system is drifting into the yellow or red zone before your apps start freezing.
If you spot a memory spike caused by a weird background process, just click it in the MacStats menu. The built-in AI Process Explainer will translate the cryptic system name into a plain English summary, telling you exactly what the process does and if it is safe to quit.
Stop stressing over raw RAM numbers. Download MacStats for Free and let our AI translate memory pressure into plain English.
Stop guessing what your Mac is doing.
Activity Monitor shows you numbers. MacStats explains them in plain English using AI. Keep an eye on your system health straight from your menu bar.
Download MacStats Free