You open Activity Monitor, check the Memory tab, and see a terrifying number. Your Mac is using 14GB out of 16GB of RAM, and all you have open is a web browser and a chat app.
Do not panic. High memory usage on a Mac is often completely normal by design. Apple engineered macOS to aggressively use available RAM to cache files and keep your system feeling snappy. Unused RAM is wasted RAM.
However, there is a big difference between healthy caching and a memory bottleneck. Here is how to tell the difference and what to do if you are actually running out of memory.
The Only Metric That Matters: Memory Pressure
Stop looking at the "Memory Used" number at the bottom of Activity Monitor. Instead, look at the Memory Pressure graph right next to it.
Memory Pressure is a color-coded chart that tells you exactly how your Mac is feeling about its current RAM situation.
- Green: Your Mac is happy. It has plenty of RAM available for new tasks. It does not matter if 99% of your RAM is technically "used". The system will instantly free up cached memory the second you need it.
- Yellow: Your Mac is starting to struggle. It is actively searching for ways to compress memory to keep things running smoothly.
- Red: You are completely out of RAM. The system is heavily relying on "Swap" memory, which will cause massive slowdowns.
What is Swap Memory?
When the Memory Pressure graph turns red, your Mac uses a trick called "Swap". It takes data from your fast RAM and temporarily writes it to your internal SSD hard drive to make room for new tasks.
Since hard drives are significantly slower than physical RAM chips, reading and writing this Swap data creates a massive bottleneck. This is when your Mac starts stuttering and giving you the spinning beachball.
A few megabytes of Swap is fine. If you see gigabytes of Swap Used, your workflow is too heavy for the amount of RAM installed in your Mac.
How to Find Memory Leaks
Sometimes, an app gets a bug where it asks the system for memory, uses it, but forgets to give it back when it is done. This is called a memory leak. Over time, that single app will quietly eat up gigabytes of RAM until your system crashes.
To find a memory leak:
- Open Activity Monitor.
- Click the Memory tab.
- Sort the list by the Memory column from highest to lowest.
If you see a simple background utility or a single browser tab consuming 4GB or 5GB of memory, it has probably leaked. Select the process and click the "X" button to force quit it.
If you want to understand more about memory management, check out our deep dive on Mac Memory Pressure Explained.
Real-Time Memory Visibility
Activity Monitor is fine for occasional troubleshooting, but it is annoying to keep open all the time. If you want to keep an eye on your system health without disrupting your workflow, you need a dedicated tool.
We built MacStats to put this data right where you need it.
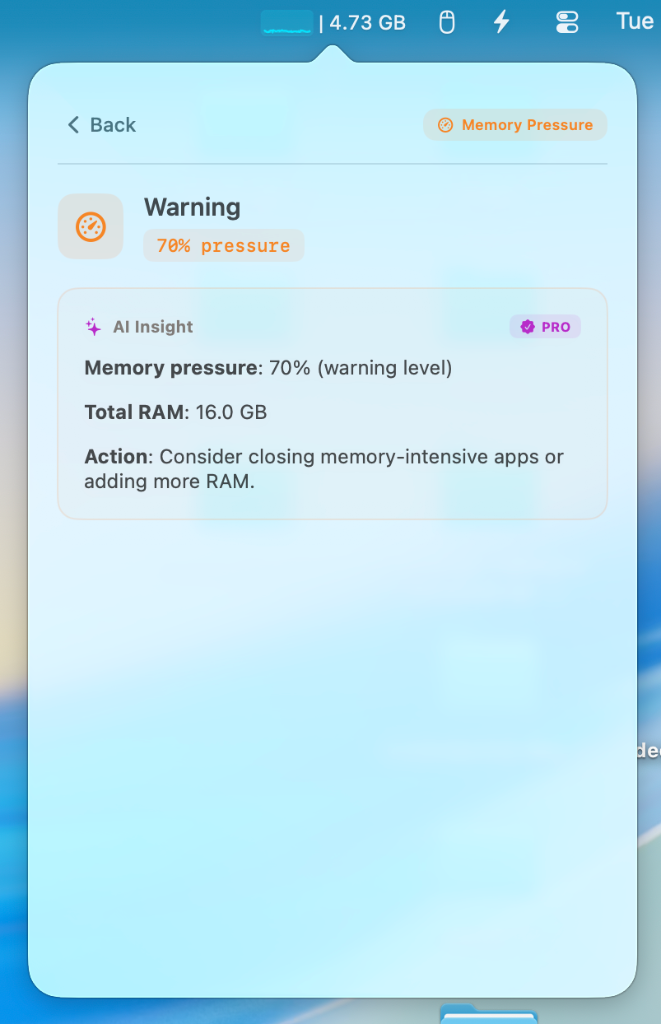
MacStats lives quietly in your menu bar, giving you a live readout of your Memory Pressure. You will know instantly if an app is starting to hoard memory before your system starts lagging.
And if you spot a weird process taking up gigabytes of RAM, you do not have to guess what it is. MacStats features a built-in AI Explainer. Just click the mysterious process, hit Ask AI, and get a plain English explanation of what it is doing and whether it is safe to quit.
Stop stressing over raw RAM numbers. Download MacStats for Free and let our AI translate memory pressure into plain English.
Stop guessing what your Mac is doing.
Activity Monitor shows you numbers. MacStats explains them in plain English using AI. Keep an eye on your system health straight from your menu bar.
Download MacStats Free